|
Over the last decade many observational results has
revised the belief that diffuse clouds are simple environments (almost
completely homogeneous medium, illuminated by the mean Galactic field,
with physical and chemical processes dominated by the interaction with
the radiation) and some questions remain unanswered. One of the most
important problems is to understand the formation and
destruction mechanisms of simple molecules such as CH+ and OH, that
would require formation energies much higher than those typical of diffuse
clouds.
This line of research is devoted to the investigation of physical processes
which, modifying the physical conditions (temperature, gas density,..)
of diffuse clouds could be responsible of "anomalous" molecular
formation/suppression.
In particular, the availability of the large database of far-UV spectra
present in the FUSE (Far Ultraviolet Spectroscopic Explorer) Archive
gives us the unique opportunity to study the excitation properties of
the high rotational (J>2) levels of molecular hydrogen and to use
them as a diagnostic tool of the physical properties of the medium.
We selected about 200 lines of sight from a set of OB stars observed
by FUSE, showing apparent diffuse properties. We are currently carrying
out the complete analysis of these spectra: in particular, applying
a profile fitting method (using the free software OWENS) on the rotational
lines, we are able to estimate the H2 column density in the first six
(J=0-->5) rotational levels of the ground vibrational and electronic
state. The following figure shows an example of the fit performed. From
the relative population of H2(J=0,1), supposed to be primarily driven
by thermal proton collisions, we can calculate for each line of sight
the excitation temperatures T_01, which is commonly assumed as an indicator
of the kinetic temperature.
From the populations of higher-J levels (determined by UV and formation
pumping and radiative cascade), we can calculate other physical diagnostic
tools like the excitation diagrams (see the example shown in Fig.7 )
and the ortho-to-para ratio. The large database we are analysing will
allow us to study the physical conditions of diffuse clouds in a statistically
significant manner. The results of this work, which have been partially
part of the degree thesis of Emanuele Congiu, are currently being prepared
for publication |
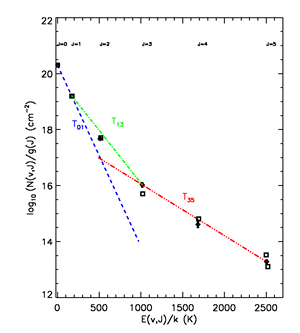
Example of excitation diagram for
J=0 through J=5. The linear fit (blue dashedline)
for the T_01 corresponds to the assumed kinetic temperature derived
from J=0 and J=1. The green and red lines are fit to the two couple
of levels J=1,3 and J=3,5 and correspond to the excitation temperatures
T_13 and T_35.
|